Plan sample size
Question
How many independent units are needed for the chosen effect?
See every package-generated example · Read the complete analysis pipeline
When to use
Use this before data collection to estimate power at a chosen independent-unit count or the count needed for a scientifically meaningful effect.
Example figure
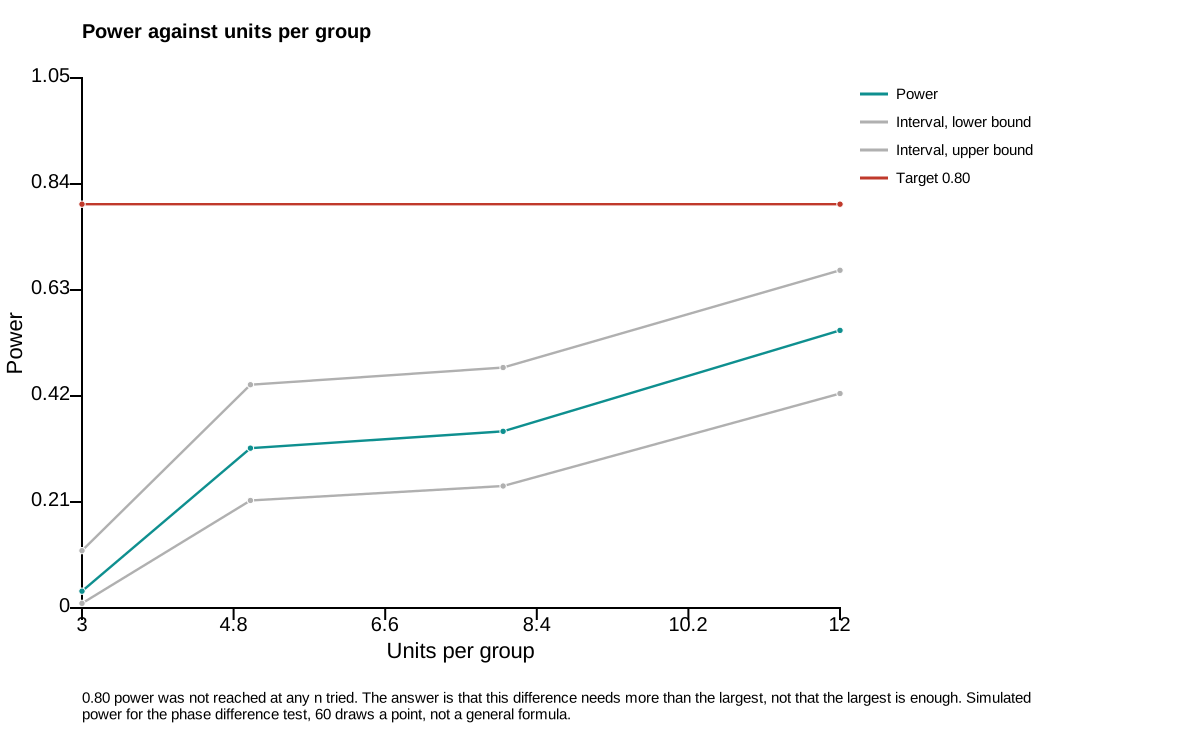
This deterministic example is calculated by the sample_size action and drawn by render_sample_size_svg, the same renderer used for publication export. Empty or withheld elements are therefore visible exactly as they are in a real result.
import circadian_workbench as cw

cw.call("sample_size", question="phase_difference", difference=2, resultant_length=0.85)
Required inputs and controls
The public function is the registered action below. settings= is accepted as a friendlier alias for config= by cw.call; the calculation stores the complete normalized config in provenance.
Function reference
cw.call("sample_size", question='phase_difference', difference, resultant_length=0.8, n_per_group=None, target_power=0.8, config=None)
Arguments and parameters
| Name | Type | Required | Default | Units | Meaning |
|---|---|---|---|---|---|
question |
string | no | "phase_difference" |
- | Which power question to answer: 'phase_difference' for two groups of phases compared on the circle, or 'mesor', 'amplitude' or 'rhythm_phase' for a cosinor parameter compared between two cohorts. 'observed' asks for post-hoc observed power and is refused with the reason, because it is a restatement of the p-value you already have. |
difference |
float | yes | — | hours or recording units | The smallest difference worth detecting, in the parameter's own units: hours for a phase, recording units for a mesor or an amplitude. Not the difference you observed -- the one that would change your mind. |
resultant_length |
float | no | 0.8 |
- | How tightly the phases within a group cluster, from 0 (scattered) to just under 1 (identical). This is the R that phase_comparison reports, so a pilot's number goes straight in. Only used by the phase_difference question. |
n_per_group |
integer | no | null |
units per group | Give it to ask 'what power do I have at this n'. Leave it out to ask 'how many do I need', which searches over n instead. |
target_power |
float | no | 0.8 |
- | The power the search aims for when n_per_group is not given. 0.8 by convention; the returned n is the smallest whose interval clears it, not whose point estimate does. |
config |
object | no | null |
- | Partial analysis config. Missing keys fall back to analysis.DEFAULT_CONFIG and out-of-range values are clamped silently — run describe_config for every key, its default and its allowed values, or normalize_config to see what a given config actually becomes. |
Every nested config key, default, allowed value, and purpose is listed in the complete configuration reference.
How it works
The package simulates the same circular-phase or differential-cosinor test used in analysis. Power is the rejection fraction and Wilson intervals carry Monte Carlo uncertainty; sample-size search uses the interval rather than the point estimate.
$$ \widehat{\mathrm{power}}=\frac{\text{rejected simulations}}{S} $$
Implementation: power.py::phase_difference_power / rhythm_parameter_power.
Outputs and interpretation
The result returns the question, assumptions, candidate sample sizes, power estimates and Wilson intervals, target, recommended size or achieved power, simulations, runtime, and warnings.
cw.call returns a Result: use .data for calculated values, .warnings for scientific qualifications, .provenance for version and input identity, .script for an equivalent replay script, and .files for saved outputs.
Limitations
The answer is conditional on the supplied meaningful effect and dispersion. Post-hoc observed power is refused because it only restates the observed p value.
Example
The figure above is a real package result from a seeded, redistributable synthetic dataset. Its audited project bundle retains figure_data.csv, a standalone plot.py, source hashes, an editable SVG, and a rendered preview.
Methods text
Prospective power was estimated by simulating the package's target inferential test under the declared minimum meaningful effect; Wilson intervals described simulation uncertainty and determined the recommended sample size.
See also
Predict the entrainment range · Predict re-entrainment · Fit the two-process sleep model · Analysis index · Gallery