Separate phase and period dispersion
Question
Did coherence fall because periods diverged or phases spread?
See every package-generated example · Read the complete analysis pipeline
When to use
Use this after population synchrony when coherence loss may arise from cells having different intrinsic periods rather than different starting phases.
Example figure
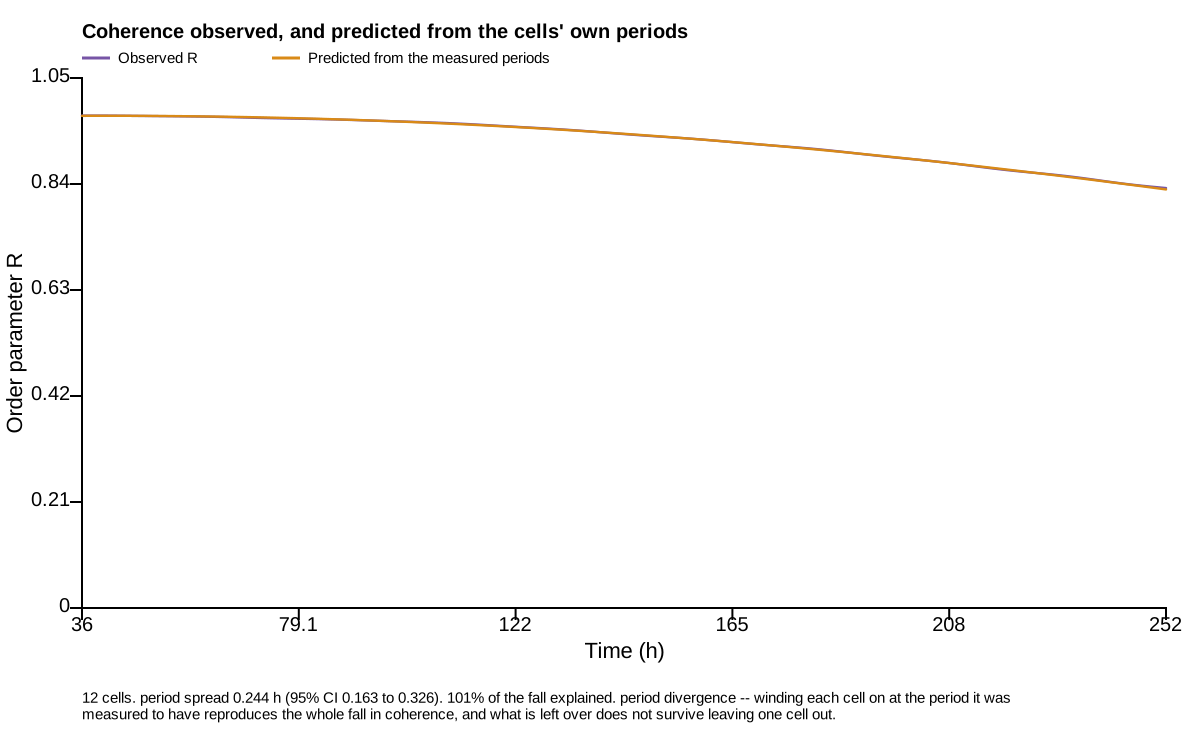
This deterministic example is calculated by the period_dispersion action and drawn by render_period_dispersion_svg, the same renderer used for publication export. Empty or withheld elements are therefore visible exactly as they are in a real result.
import circadian_workbench as cw

cw.population(hours, cell_traces).period_dispersion()
Required inputs and controls
The public function is the registered action below. settings= is accepted as a friendlier alias for config= by cw.call; the calculation stores the complete normalized config in provenance.
Function reference
cw.call("period_dispersion", traces, hours, config=None)
Arguments and parameters
| Name | Type | Required | Default | Units | Meaning |
|---|---|---|---|---|---|
traces |
object | yes | — | recording units | Single-cell traces on one shared time grid: {'roi_1': [values], ...}. Per-ROI output from a slice recording. |
hours |
array | yes | — | hours | The shared time grid the traces are sampled on, in hours from the start of the recording. |
config |
object | no | null |
- | Partial analysis config. Missing keys fall back to analysis.DEFAULT_CONFIG and out-of-range values are clamped silently — run describe_config for every key, its default and its allowed values, or normalize_config to see what a given config actually becomes. |
Every nested config key, default, allowed value, and purpose is listed in the complete configuration reference.
How it works
Each trace contributes an initial phase and period. Phase trajectories predicted from period alone are compared with trajectories that preserve the observed starting-phase spread.
$$ \theta_i(t)=\theta_{i0}+\frac{2\pi t}{\tau_i} $$
Implementation: synchrony.py::period_dispersion.
Outputs and interpretation
The result reports per-trace periods and phases, observed and predicted coherence, period spread, phase spread, decay summaries, cycles, uncertainty, and which source better explains dispersion.
cw.call returns a Result: use .data for calculated values, .warnings for scientific qualifications, .provenance for version and input identity, .script for an equivalent replay script, and .files for saved outputs.
Limitations
Each trace needs enough cycles for a period estimate. Period dispersion predicts passive phase spread; it is not direct evidence for or against biological coupling.
Example
The figure above is a real package result from a seeded, redistributable synthetic dataset. Its audited project bundle retains figure_data.csv, a standalone plot.py, source hashes, an editable SVG, and a rendered preview.
Methods text
Per-trace period and initial phase were used to predict population coherence through time, separating dispersion attributable to unequal periods from dispersion already present in starting phase.
See also
Compare measurement channels · Measure population synchrony · Map phase across space · Analysis index · Gallery