Summarise scored phases
Question
Are these scored clock phases clustered?
See every package-generated example · Read the complete analysis pipeline
When to use
Use this for already scored clock phases from independent observations.
Example figure
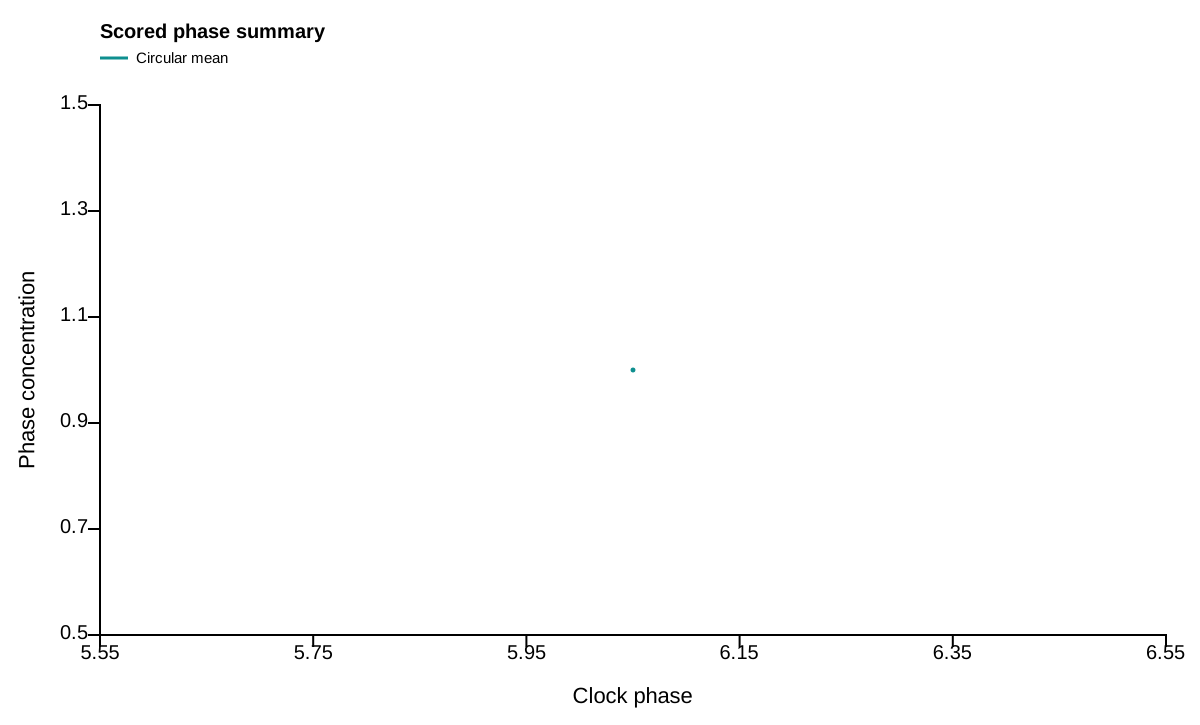
This deterministic example is calculated by the phase_summary action and drawn by render_phase_summary_svg, the same renderer used for publication export. Empty or withheld elements are therefore visible exactly as they are in a real result.
import circadian_workbench as cw

cw.call("phase_summary", phase_values=[5.8, 6.1, 6.2, 5.9])
Required inputs and controls
The public function is the registered action below. settings= is accepted as a friendlier alias for config= by cw.call; the calculation stores the complete normalized config in provenance.
Function reference
cw.call("phase_summary", phase_values, config=None, period_hours=None, label='')
Arguments and parameters
| Name | Type | Required | Default | Units | Meaning |
|---|---|---|---|---|---|
phase_values |
array | yes | — | hours | Phase values for one group or tissue, expressed on one shared cycle. |
config |
object | no | null |
- | Partial scientific settings. Omitted or None values use the shared installed defaults; invalid fresh values are rejected. Run describe_config for names, meanings, units, bounds and choices. Explicitly load old saved mappings with load_saved_settings to report compatibility conversions. |
period_hours |
float | no | null |
hours | The cycle the phases live on. Omit to use the config's period_hours (24 h by default). A free-running cohort should pass its own tau, so that 'one cycle' means one of the animals' cycles rather than one solar day. splitting uses it for a second purpose that is the same idea: the period the resolution element P**2/T is worked out at, which sets how far apart two components must be before that record can show them to differ. |
label |
string | no | "" |
- | Readable name returned with the single-group phase summary. |
Every nested config key, default, allowed value, and purpose is listed in the complete configuration reference.
How it works
Phases are wrapped to the declared period, then summarized with circular statistics.
$$ R=\left|n^{-1}\sum_i e^{2\pi i\phi_i/P}\right| $$
Implementation: circular.py::phase_summary.
Outputs and interpretation
The result reports circular mean, concentration, spread and clustering evidence.
cw.call returns a Result: use .data for calculated values, .warnings for scientific qualifications, .provenance for version and input identity, .script for an equivalent replay script, and .files for saved outputs.
Limitations
The supplied phases must share one reference and period; an average does not establish entrainment.
Example
The figure above is a real package result from a seeded, redistributable synthetic dataset. The flat gallery bundle retains figure_data_scored-phase-summary.csv, a standalone plot_scored-phase-summary.py, source hashes, an editable SVG, and a rendered preview.
Methods text
Scored phases were summarized by their circular mean and resultant length.
See also
Compare period estimates · Test rhythmicity · Detect two circadian components · Analysis index · Gallery